")
By Cindy Alvarez & Bob Newkirk
Capital efficiently and frequently flows between bonds and stocks. It pays to keep an eye on yields offered by these markets.
– Naved Abdali
For many of the past 15 years, bonds provided returns both relatively low and relatively safe.
A low inflation and low interest rate environment made stocks and other riskier investments
more attractive. However, interest rates on fixed income investments have recently increased,
while valuations of more speculative assets have in some cases collapsed. As a result, investors
are evaluating revised fixed income investment strategies. In this first installment of a two-part
series, we review the basics and modern history of bond investing.
Bonds & Fixed Income
“Bonds” are technically part of a larger fixed income market, though the terms are sometimes and confusingly – used interchangeably. The fixed income market consists of a wide variety of debt securities. These include the more specific category of “Bonds,” or loans with an initial maturity date 10 or more years in the future. “Notes’’ have an initial maturity date of one to 10 years. “T-bills,” shorthand for Treasury Bills, is federal, U.S. Treasury debt with a maturity of one year or less. “Certificates of Deposit” or “CDs” are bank-issued debt with a range of shorter maturity dates, protected by federal deposit insurance. Finally, “commercial paper” is corporate debt with a maturity of 270 days or less.
As these descriptions suggest, many different types of entities issue debt securities. These include the U.S. and foreign governments, state and local governments, and corporations, including banks. For our purposes here, we will use “bonds” as a general term for a variety of fixed income investments.
Bond vs. Stocks
A bond is simply a type of loan or debt. An investor provides capital to a borrower. In return,
the borrower has a legal obligation to return the bond’s face value (also known as par value) at
some point in the future, known as the maturity date. The lender will also usually have to pay
interest, in the form of a stated coupon rate at specified intervals, to compensate the investor.
The coupon rate is usually stated as an annual percentage of, or interest rate on, the face value.
For example, a company might issue a bond with a face value of $1000, with a coupon rate of
5% (or $50 annually) paid in quarterly installments until the $1000 face value is returned in
10 years.
Bonds generally have lower risk, and therefore lower return, than stocks. In the event of bankruptcy bondholders have priority; they get paid before stockholders. This lowers the risk for bondholders. However, unlike stockholders, bondholders cannot directly gain additional profits from growth in the value of the underlying business. They are entitled only to the face value and interest payments, no matter how well the business performs. This lowers the potential return for bondholders.
Bond Returns & Yields
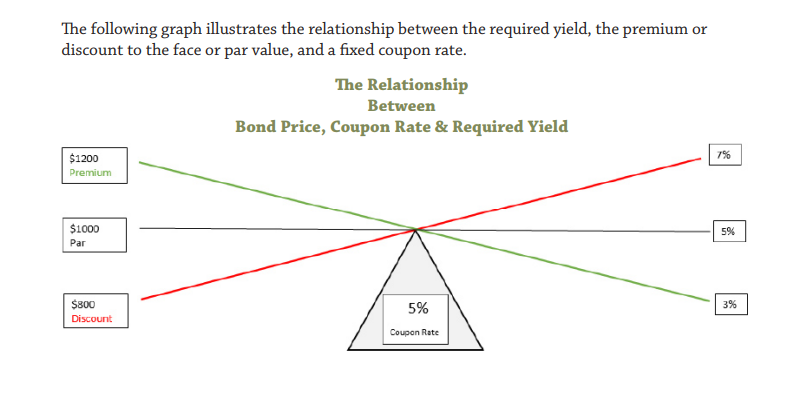
When a borrower issues a bond to an investor, the initial price may be higher or lower than the face value. If the price is higher than the face value, the investor is paying a premium. If lower, the investor receives a discount. There is also an active secondary market, where bonds are traded after the initial issuance. As the price paid for a bond rises or falls, so does the premium or discount. For example, if the face value of a bond is $1000, and the current price investors are willing to pay is $900, there is a $100 discount.
Yield is a common term for the rate of return on a bond investment. There are several ways to measure the investment return on a bond. A simple measure is the current yield. The current yield is simply the amount of the annual coupon payments divided by the bond’s current market price (face value plus or minus a premium or discount). Using our prior examples, a $50 annual coupon rate divided by a $900 current price gives a current yield of $50/$900, or 5.56%. It follows that the higher the discount, and the lower the price paid for a bond, the higher the yield.
Risks, Required Yields & Bond Prices
The required yield, or rate of return, investors will require on a bond investment is a function of default risk and interest rate risk. Default risk is the risk the issuer will not be able to pay the coupon rate or face value, or both. For some struggling corporations, this risk is high. For the U.S. government, the default risk is nearly zero – the Treasury can always print more money.
Interest rate risk is the risk that interest rates will increase, making the bond less valuable. The value drops because the coupon rate is fixed. If interest rates rise, that coupon rate becomes less attractive and the value of the bond drops. For bonds with a maturity date far into the future, this risk is higher since there is a longer time period during which rates may increase. Conversely, short-term bonds have lower interest rate risk.
Since interest rates and inflation are intertwined, changes in inflation change the interest rate risk. This in turn affects the current prices of bonds. Usually, higher inflation results in higher interest rates, and the prices of issued bonds fall. Investors will require a higher yield on bonds in inflationary times. (See Who’s Afraid of the Big, Bad Fed? Federal Reserve Policies Explained and Could Inflation Affect My Investments?)
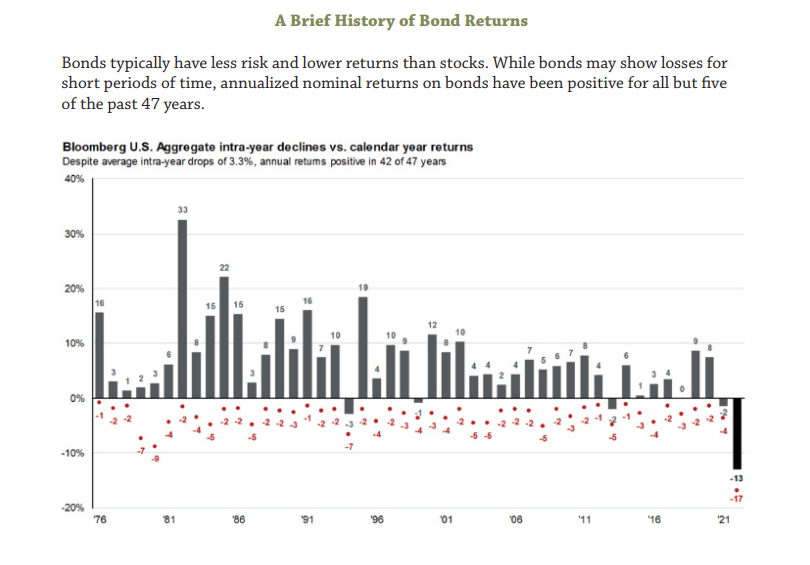
For some investors, the relative stability of bonds is worth the trade off of a lower return. However, as the chart describes, 2022 was a bad year for bonds. It was also a bad year for most major investment categories. (See The 2022 Bear Market: No Place to Hide)
An Inverted Yield Curve & Its Implications
The tumultuous year of 2022 also saw the emergence of an inverted yield curve. This phenomenon occurs when the yields on longer-term U.S. Treasury bonds are lower than shorter-term returns. In “normal” times, interest rate risk means investors would want higher returns on longer term bonds. When the difference or “spread” between 10-year U.S. Treasury bonds and 2-year Treasury bonds is negative, the yield curve is inverted. That has been the case since July of last year.

An inverted yield curve means investors believe that interest rates will be lower in the future than they are now. One possible reason for this belief is that inflation will be lower in the future. Another reason would be the effects of a recession. According to a recent Wall Street Journal survey of economists, there is a 61% chance of a recession in the next 12 months.(See also Will the Fed’s Inflation Fight Cause a Recession?)
An Informed Approach to Bond Investing
Bonds are often an important part of a portfolio. This is particularly true for older or more conservative investors. A well-informed investor understands there are a wide variety of fixed income options available, and the risks and returns associated with each. Although the market environment in 2022 was daunting, shifts in the fixed income market may provide new opportunities. We will address possible investment strategies in a second installment of this two-part series on bond investing.
Cindy Alvarez is a Senior Wealth Management Advisor and an Owner of Wambolt & Associates. Bob Newkirk is a registered C.P.A, former investment banker, and prior Fellow in Law and Economics at the University of Chicago.
The views expressed in this article reflect the personal opinions, viewpoints and analyses of the Wambolt & Associates, LLC employees or contractors providing such comments, and should not be regarded as a description of advisory services provided by Wambolt & Associates, LLC or performance returns of any Wambolt & Associates, LLC client. The views reflected in this whitepaper are subject to change at any time without notice. This whitepaper is intended to provide education about the financial industry. It is NOT intended to provide investment advice, performance data or any recommendation that any particular security, portfolio of securities, transaction or investment strategy is suitable for any specific person. Any mention of a particular security and related performance data is not a recom mendation to buy or sell that security. Wambolt & Associates, LLC manages its clients’ accounts using a variety of investment techniques and strategies, which are not necessarily discussed in the whitepaper. Past performance is no guarantee of future results. Please remember that all investing involves the possible risk of loss of principal capital. Wambolt & Associates, LLC is a registered investment adviser. Advisory services are only offered to clients or prospective clients where Wambolt & Associates, LLC and its representatives are properly licensed or exempt from licensure. No advice may be rendered by Wambolt & Associates, LLC unless client service agreement is in place.